



Multifamily resident experience software is worth it when it replaces work staff already do by hand and enough residents use it. Otherwise it is a brochure. URBI is built for the first case: one platform for maintenance, packages, amenities, communication, and payments, with a live adoption score.
What does it cost a building to not have resident experience software?
It costs staff hours every week and a share of every turn you failed to prevent. Neither line shows up on the budget as a software line item, which is why the question feels harder than it is.
Start with turnover, because it is the largest number. Every move out carries days of vacancy, make ready labor, marketing, and concessions on the next lease. Counted fully, one turn usually adds up to somewhere between one and two months of that unit's rent. Your own ledger will tell you the exact multiple. The point is that even a small change in renewals moves more money than any amount of staff efficiency.
Turnover is also where the industry has been focused. In early 2025 reporting on first quarter earnings, Multifamily Dive listed annualized turnover in the low 30s to low 40s percent range at several large public apartment owners, with executives calling those figures among the lowest in company history. Taylor Verhaalen, president of Stout Management, put the economics in one line in that article: "Keeping someone is cheaper than bringing someone in."
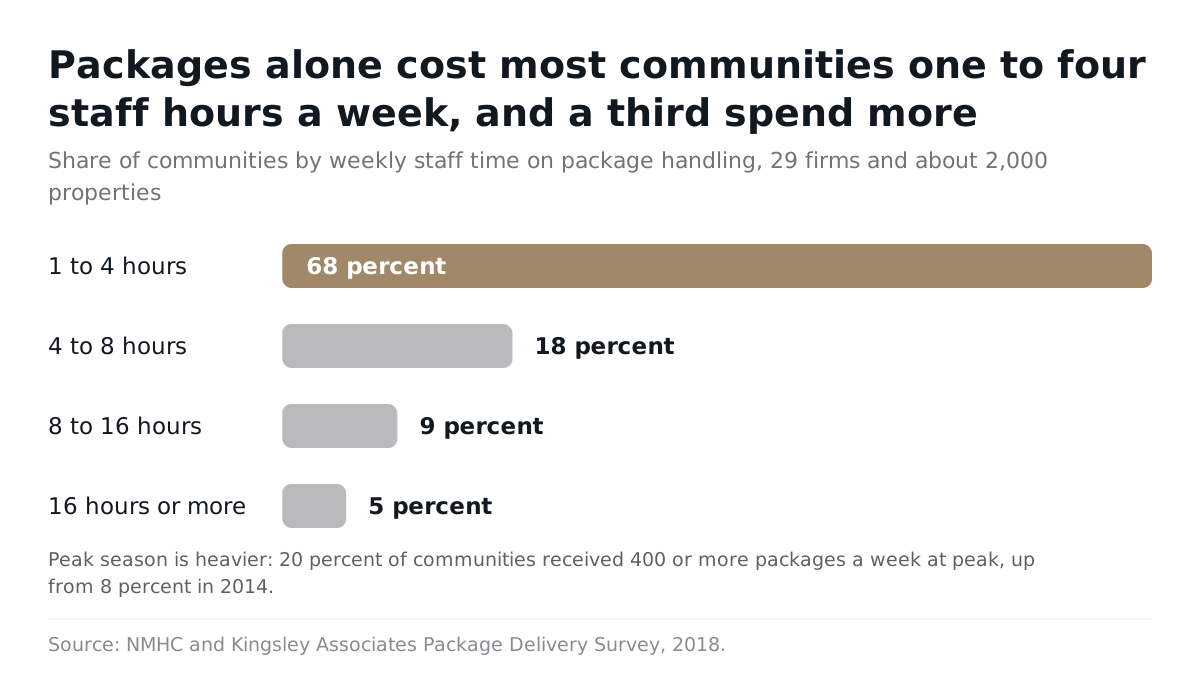
Then count the request work. Packages are the easiest example because the industry has measured it. In the 2018 NMHC and Kingsley package delivery survey, covering 29 firms and roughly 2,000 properties, most communities reported spending one to four staff hours a week on packages, and about a third spent more than that. Peak season was worse: 20 percent of communities received 400 or more packages a week at peak, up from 8 percent in 2014. Package volume has not gone down since.
| Staff time on packages per week (2018 NMHC and Kingsley survey) | Share of communities |
|---|---|
| 1 to 4 hours | 68 percent |
| 4 to 8 hours | 18 percent |
| 8 to 16 hours | 9 percent |
| 16 hours or more | 5 percent |
Maintenance requests, amenity bookings, guest parking, and "did my package arrive" calls follow the same pattern. Each one is a few minutes. Multiplied across a building, they are a part time position that nobody hired for. The things residents ask for most are exactly the things that generate that volume.
Where does the ROI show up first?
Staff time shows up first, usually within the first two or three months. Retention shows up last, because you have to wait for a renewal cycle to see it. Reviews and ancillary revenue sit in between.
The staff time gain is the easiest to see because it happens at the front desk. Operators who moved requests into self service describe the same thing: fewer phone calls, and the calls that remain come with better detail. In a 2023 Multi Housing News set of case studies, James Love, vice president of marketing and brand at Draper and Kramer, said of a centralized resident system: "it's also convenient for us to manage because it's all in one place." The same article noted the limits. Integrations can fail, and some residents still prefer a paper check or an in person conversation.
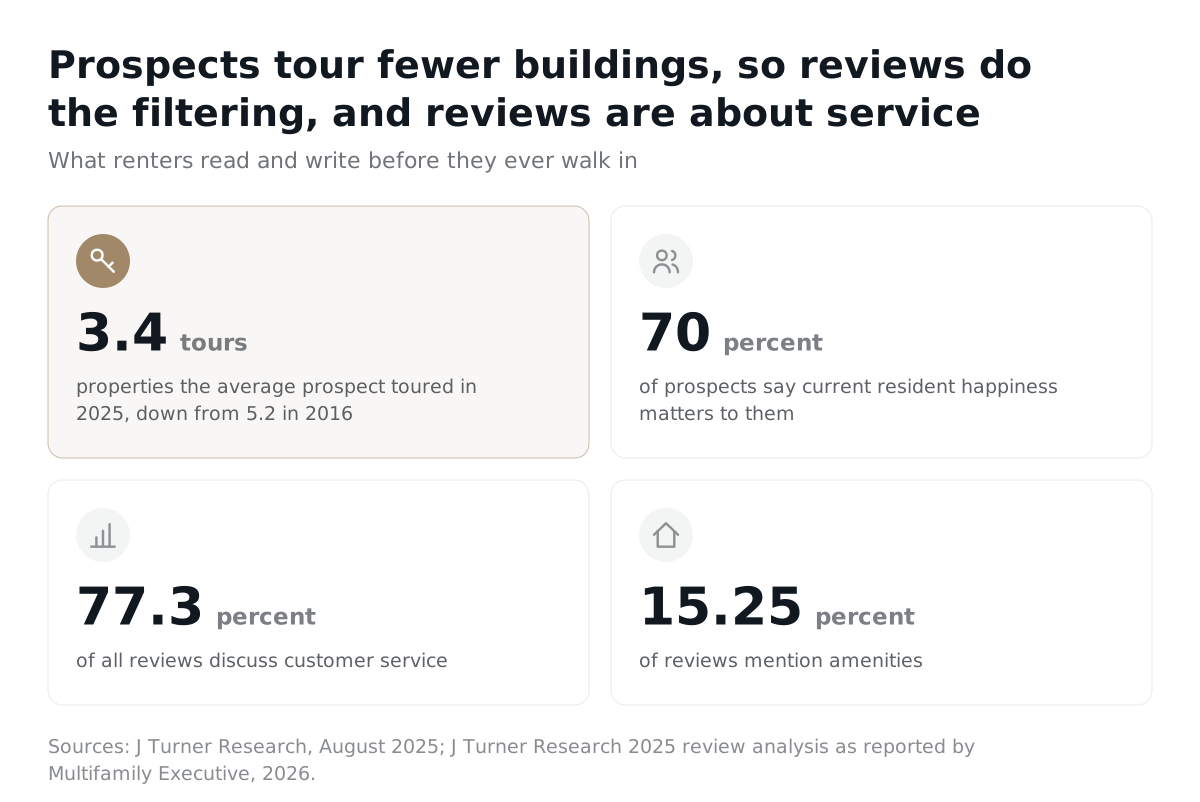
Reputation is the second place value appears, and it feeds leasing rather than renewals. Prospects tour fewer buildings than they used to. J Turner Research reported in August 2025 that the average prospect toured 3.4 properties, down from 5.2 in 2016, and that 70 percent of prospects say current resident happiness matters to them. Fewer tours means reviews do more of the filtering before anyone walks in.
What residents write about is service, not amenities. A 2025 J Turner analysis reported by Multifamily Executive found that 77.3 percent of all reviews discussed customer service, and 66.2 percent of one and two star reviews complained about it. Amenities appeared in only 15.25 percent of reviews. A maintenance request that closes on time, with a note to the resident, is review content. A rooftop lounge mostly is not.
| ROI source | When it appears | How you measure it | How strong the evidence is |
|---|---|---|---|
| Staff time | Weeks to a few months | Calls, package touches, and minutes per request, sampled before and after | Consistent operator reports, few controlled studies |
| Reviews and leasing | One to two leasing seasons | Review volume, rating, share of reviews mentioning service, tours per lease | Strong on what residents write about, weaker on attribution |
| Ancillary revenue | First quarter after launch | Paid bookings, deposits collected, marketplace share | Depends entirely on your amenity mix |
| Retention | A full renewal cycle, often 12 months | Renewal rate by cohort against a comparison property | Plausible, mostly vendor reported |
Ancillary revenue is real but building specific. If you have party rooms, guest suites, or paid parking, moving bookings and deposits into an app that collects the money usually pays for itself on its own. If you have a gym and a mailroom, do not count on it. Our post on amenity management software for pools, spas, and gyms covers where booking revenue actually comes from.
Where do vendor ROI claims fall apart?
They fall apart at adoption. Almost every vendor page quotes a renewal lift, and almost none of them publish the cohort size, the baseline, or a control group. A renewal figure without those three things is a marketing sentence.
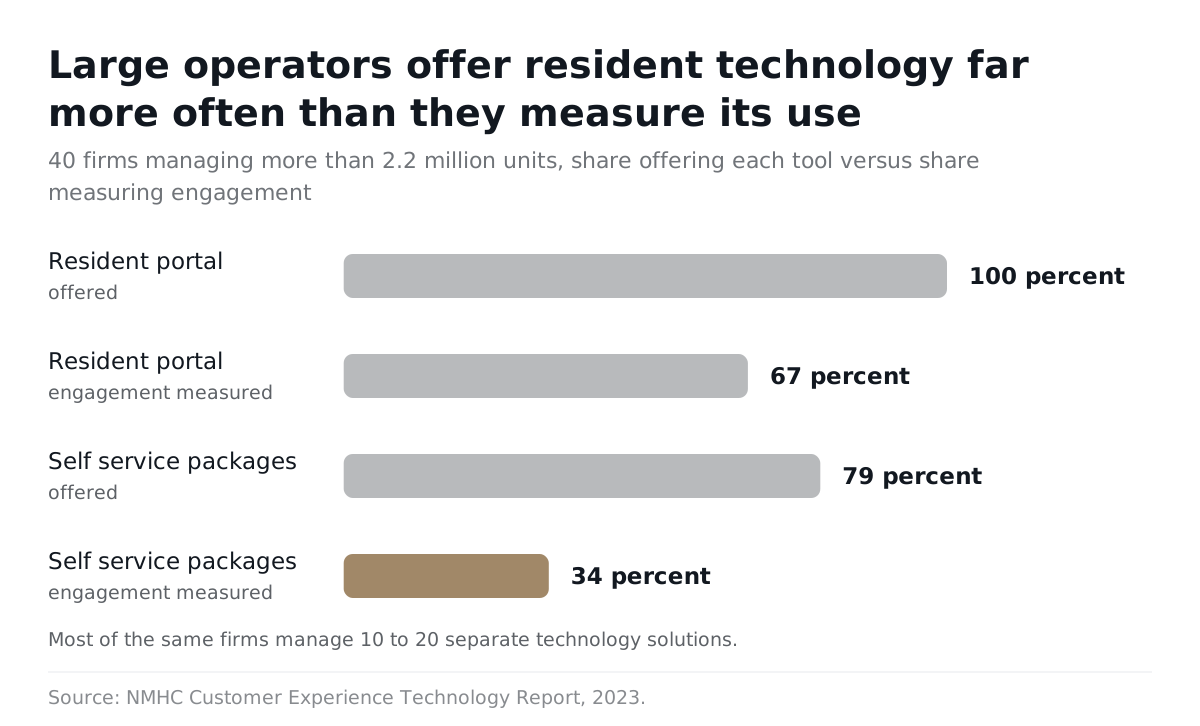
The gap between what operators offer and what they measure is the tell. In the 2023 NMHC customer experience technology report, all 40 participating firms (representing more than 2.2 million units) offered a resident portal, but only 67 percent measured engagement with it. For self service package systems the numbers were 79 percent offering and 34 percent measuring. Most of those firms were also managing 10 to 20 separate technology solutions. If one in three large operators cannot say how many residents use their portal, a vendor claiming a precise renewal lift across its customer base is guessing on their behalf.
| Technology (2023 NMHC report, 40 firms) | Share offering it | Share measuring engagement |
|---|---|---|
| Resident portal | 100 percent | 67 percent |
| Self service package management | 79 percent | 34 percent |
The second failure is app fatigue. A resident who already has one app for rent, one for the gate, one for packages, and one for the gym is not going to open a fifth one for community events. Every extra login lowers the usage of all of them. Our guide to resident app adoption covers how buildings get residents to keep opening the app after week one. The short version is that they put the tasks residents already have to do in the app, and they put them in one app.
The third failure is the wrong feature order. Renters leave over rent, slow maintenance, and safety. They rarely leave over a missing social feed. A platform that starts with events and community posts and treats maintenance as an add on has the priorities backwards. Reviews say the same thing: service is what people write about.
The one controlled test worth knowing about is old and it was about leasing, not retention. In 2009 Archstone ran a nine month study across 7,200 units and 40 properties, half test and half control, reported by Multifamily Executive in 2010. Answering every inbound lead call, combined with revenue management data, raised guest card traffic 37 percent and captured rent by 150 basis points, even though test property occupancy was slightly lower. Steve Lefkovits, president of Joshua Tree Consulting, who verified the study, was direct about the mechanism: "The revenue increase was not from increased occupancy." The lesson for a resident experience purchase is the method: pick a workflow, run it against a control, and count.
How do you run the math for your own property?
You need seven numbers from your own building, and you can get all of them in an afternoon. Do not borrow any of them from a vendor deck.
| Variable | Where to get it | Typical range to sanity check against |
|---|---|---|
| U: units | Rent roll | Your building |
| T: annual turnover rate | Move outs in the last 12 months divided by U | Low 30s to 50s percent for market rate |
| D: days vacant per turn | Move out date to next move in, averaged | Three to eight weeks |
| C: cost of one turn in months of rent | Vacancy days plus make ready plus concessions plus marketing, divided by monthly rent | One to two months of rent |
| R: requests per unit per month | Count tickets, packages, bookings, and calls for one typical month | Two to six |
| M: staff minutes per request today | Time 20 requests with a stopwatch | Five to fifteen |
| A: expected active adoption | Share of households using the app monthly | Plan on 50 to 70 percent, not 98 |
Now the formula, in words rather than symbols.
- Staff hours saved per year = units, times requests per unit per month, times minutes saved per request, times adoption, times 12, divided by 60. Minutes saved is the difference between what a request costs by phone and what it costs when it arrives as a ticket with a photo. Assume you save roughly half the minutes, not all of them, because someone still has to do the work.
- Turns at stake per year = units, times turnover rate. This is the number you are trying to shrink.
- Turns avoided per year = units, times the improvement in renewal rate you believe the software drives, in percentage points. Use a small number here. One to three points is a defensible assumption. Ten is not.
- Months of rent saved from turnover = turns avoided, times the cost of a turn in months of rent.
- Ancillary revenue = paid bookings and deposits you collect in the app that you were not collecting before, minus refunds.
- Annual benefit = staff hours saved, converted at your loaded hourly cost, plus months of rent saved, converted at your average rent, plus ancillary revenue.
- Payback in months = total first year cost of the platform, including setup and training time, divided by monthly benefit.
Two things usually surprise operators when they run this. The first is how little the staff time line matters compared with the turnover line. Even at a conservative one point of renewal improvement, a 200 unit building avoids two turns a year, which at one and a half months of rent each is more than most buildings save in front desk minutes. The second is how much adoption controls everything. At 30 percent adoption, both lines shrink by more than half and the payback stretches past a year. The metrics worth tracking are the ones in this formula, not app downloads.
What has to be true for it to pay off?
Three conditions, and you can check all of them before signing.
- Adoption above half the building within 90 days. Below that, the software is serving a minority and the staff still runs two processes. Make it a contract term: active households per month, not licenses.
- One platform, not five. If maintenance, packages, bookings, payments, and announcements each live in a different tool, you have bought overhead. The value comes from the resident having one login and the staff having one inbox. That is also the case in our post on how to choose building communications software.
- Staff who actually use it. A ticket that a resident submits in the app and a technician reads from a printout is still a phone call with extra steps. The desk has to close the loop in the tool, or residents stop using it within a month.
The order matters too. Put the workflows residents cannot avoid in first: rent, maintenance, packages. Add amenities and events once those are habitual. Community features are the reward for adoption, not the cause of it.
How does URBI fit the math?
URBI is one platform for the tasks in the formula above, and it tells you your adoption number instead of making you guess. That second part is the difference between a business case and a hope.
Here is how each line of the calculation maps to the product, as described in the resident experience features:
- Adoption (A): the Building Health Score is a live 0 to 100 adoption and operations score per property, weighted by the last 30 days of activity, benchmarked against the platform average, with a quick win list of the next concrete actions to raise it. Regional managers see every property in a multi property roll up from one login.
- Package minutes (part of M): staff photograph a shipping label and the AI scanner reads the tracking number, carrier, and recipient unit for confirmation before posting. The resident gets a notification on arrival. Small parcels can route through smart lockers.
- Booking revenue and staff time: capacity aware amenity booking with conflict detection, card checkout, deposits, and cancellation and refund flows, so the party room stops living on a sign up sheet.
- Payments: an OTP authenticated payment portal, no app login required, where residents view bills, pay one off, or set up card autopay, and download PDF receipts.
- Calls and requests (R and M): Arthur, the resident facing AI, answers on four channels (voice, SMS, email, and in app chat), creates tickets, books amenities, registers parking, and escalates anything it cannot answer to the property manager with a summary. Arthur is a Premium feature.
- Staff inbox time: HERO, the team's AI inside the Kore dashboard, drafts an editable reply above the staff inbox composer and can propose a ticket, task, note, or notice from the thread. Nothing sends and no action fires until a person confirms. Inbox Assist requires Kore or Premium plus per user HERO access.
- Manager attention: the Chief of Staff briefing, a Premium and opt in weekday email for staff, managers, and boards, compiles what needs attention across properties. Residents never receive it.
URBI runs in thousands of doors today and has grown organically. Start with what URBI is, then read how it works for residential buildings and what the platform does for owners who want portfolio numbers rather than anecdotes. For a comparison of the category, see the best resident experience apps.
FAQ
How long until multifamily resident experience software pays for itself?
Staff time savings show up within two to three months if adoption clears half the building. Retention effects need a full renewal cycle, so plan on 12 months before you can measure them honestly. Run the formula above with your own numbers and set a 90 day adoption checkpoint. If active use is below 50 percent at that point, fix onboarding before expecting any of the rest.
Is a resident app worth it for a small building?
Yes if the building has real request volume and a thin staff. A 60 unit building with a part time manager gains more per unit from self service than a 400 unit tower with a full desk, because every avoided call is a larger share of the manager's day. The math is the same. The variables are smaller, and the payback usually comes from staff time rather than turnover.
What adoption rate should I expect from a resident app?
Plan on 50 to 70 percent of households active each month once rent, maintenance, and packages all live in the app. Vendor claims in the high 90s usually count downloads or invited accounts, not monthly use. The 2023 NMHC report found only two thirds of large operators measured portal engagement at all, so ask for the definition of "active" in writing before you compare any two numbers.
Does resident experience software actually improve renewals?
The honest answer is probably, by a few points, and only when the service behind it is good. Residents renew over rent, maintenance response, and safety. Software helps by making requests visible and closing them faster, which is what shows up in reviews. It does not rescue a building with a slow maintenance team. Measure renewal by cohort against a comparison property before crediting the app.
If you want to run this calculation with your own rent roll and request counts, write to hello@myurbi.co or book a demo and we will walk through the numbers with you, including what a Building Health Score looks like for a building your size.
Keep reading


