


Budget, Cash Flow & Governance Reports
These reports live on the Reports tab of Accounting . Cards only appear when they apply to the selected property, so some reports will not be visible on every property. Some cards on this page appear...
Last updated
These reports live on the Reports tab of Accounting. Cards only appear when they apply to the selected property, so some reports will not be visible on every property.
Some cards on this page appear only on properties whose plan includes them, and some only on certain property types. If a card is not on your Reports page, that is why.
Budget vs Actual
Who sees it: All property segments (residential condo/HOA, commercial, mixed-use).
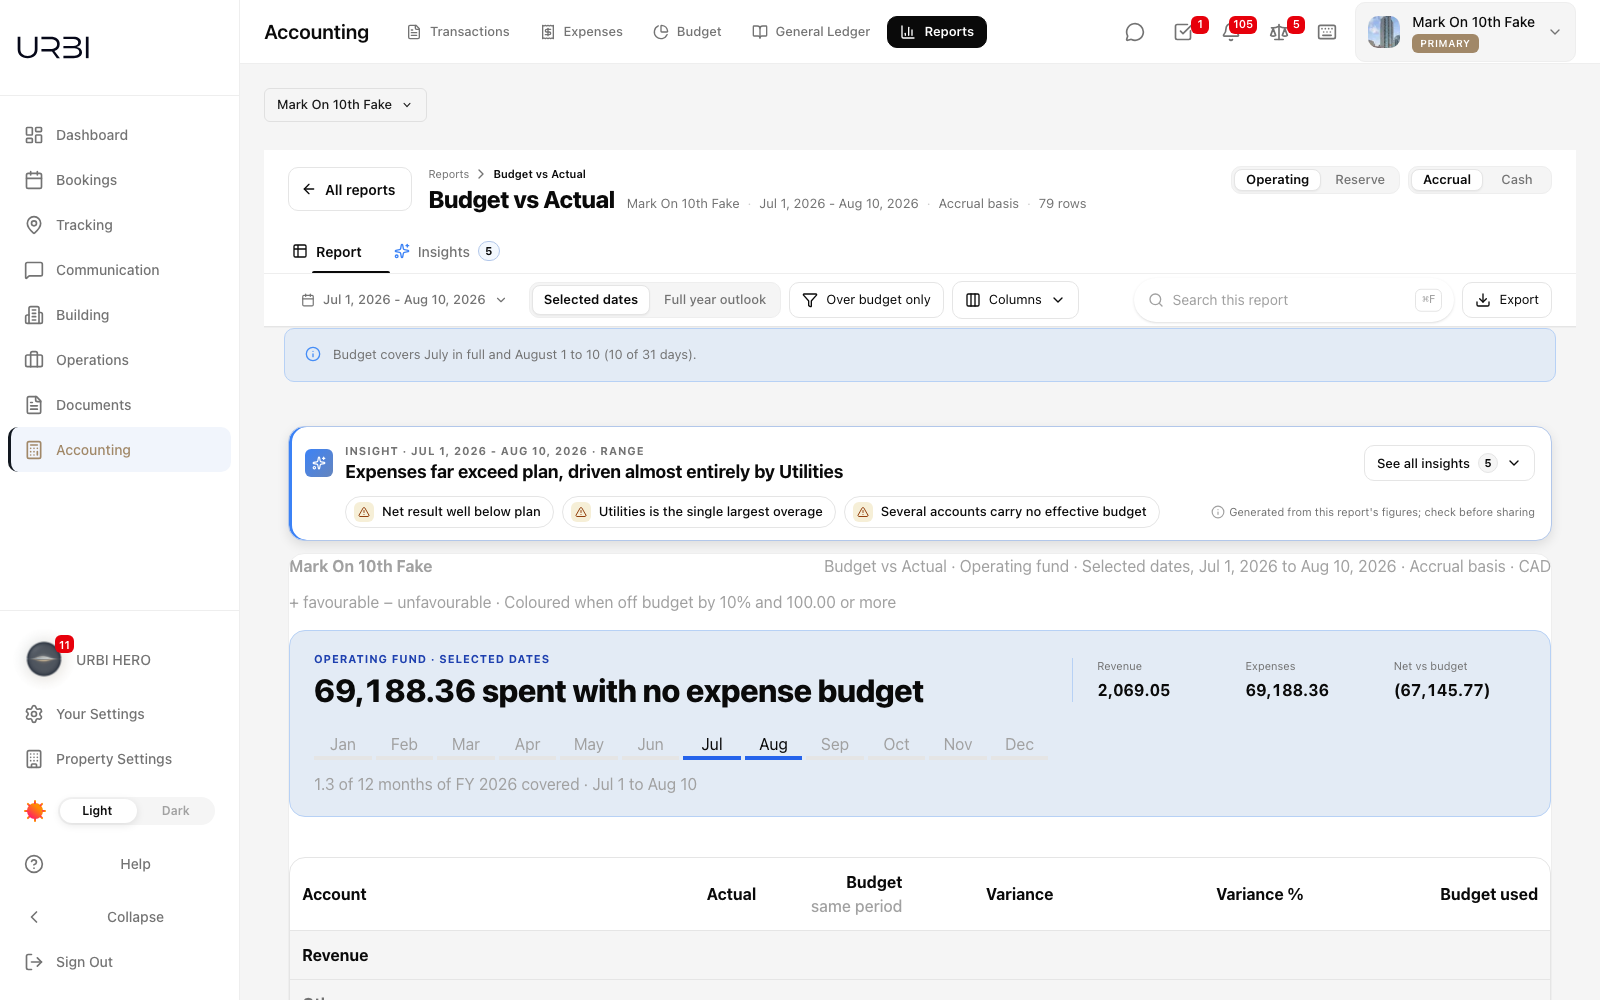
The Budget vs Actual report compares what was budgeted for each account against what was actually spent or received, showing the dollar variance and percentage variance side by side. It lists your Revenue accounts, then your Expenses, with a row for each account. Use the switch at the top to see the Operating fund or the Reserve fund.
What to look for:
- Each row shows its Variance with a plus sign when it is in your favour and a minus sign when it is against you, and a Variance % that reads On budget or Not budgeted where that applies. A row that is off budget by 10% and 100.00 or more is coloured and carries an arrow, so you do not have to read a colour alone. A bar beside Budget used shows how much of the budget has been spent.
- A group carries its own total row (for example Total utilities), each section ends with a total, and the last row is the Net operating result (Net change in reserve fund on the Reserve view).
- Choose the dates you want to review with the period button at the top. The report opens on Last month the first time you use it, and offers the same presets as every period report (This month, Last month, This quarter, Fiscal year to date, Last fiscal year and Custom). You can pick any range inside one fiscal year, for example 1 July to 10 August.
- Selected dates compares the actual spending and income in your range with the budget for the same days. Full year outlook projects the whole fiscal year from the actuals to your end date plus the budget that remains.
- Before a budget is active. If the year has no Active budget, the report shows No budget for FY 2027 yet (with the year you chose) and says it fills in by itself once the operating budget is activated in Budgets. The steps listed are to create the budget or start from last year's, enter the monthly amount for each account, and Activate it. Drafts do not appear here. The footnote on a report that has a budget reads, for example, "Budget is the active FY 2026 operating budget (activated Jan 5, 2026)".
- Over budget only. With Selected dates, the note says how many accounts are over budget "for the selected dates: spending above its budget, or revenue below it." With Full year outlook it says they are over budget "on projected year-end variance: spending projected above its budget, or revenue projected below it." Totals still include every account.
Budget vs Actual does not have a Compare option. Its Budget and Variance columns are part of the report itself. Use the Columns control if you need to hide or show those columns.
How the budget is matched to your dates. A budget is set month by month. When your range covers only part of a month, that month's budget is shared out by the number of days inside your range, so a range of 1 July to 10 August uses July in full and 10 of August's 31 days. A note under the toolbar states exactly what is covered, for example Budget covers July in full and August 1 to 10 (10 of 31 days). A range made of whole months uses each month's stored budget exactly. The Entries count follows your range too.
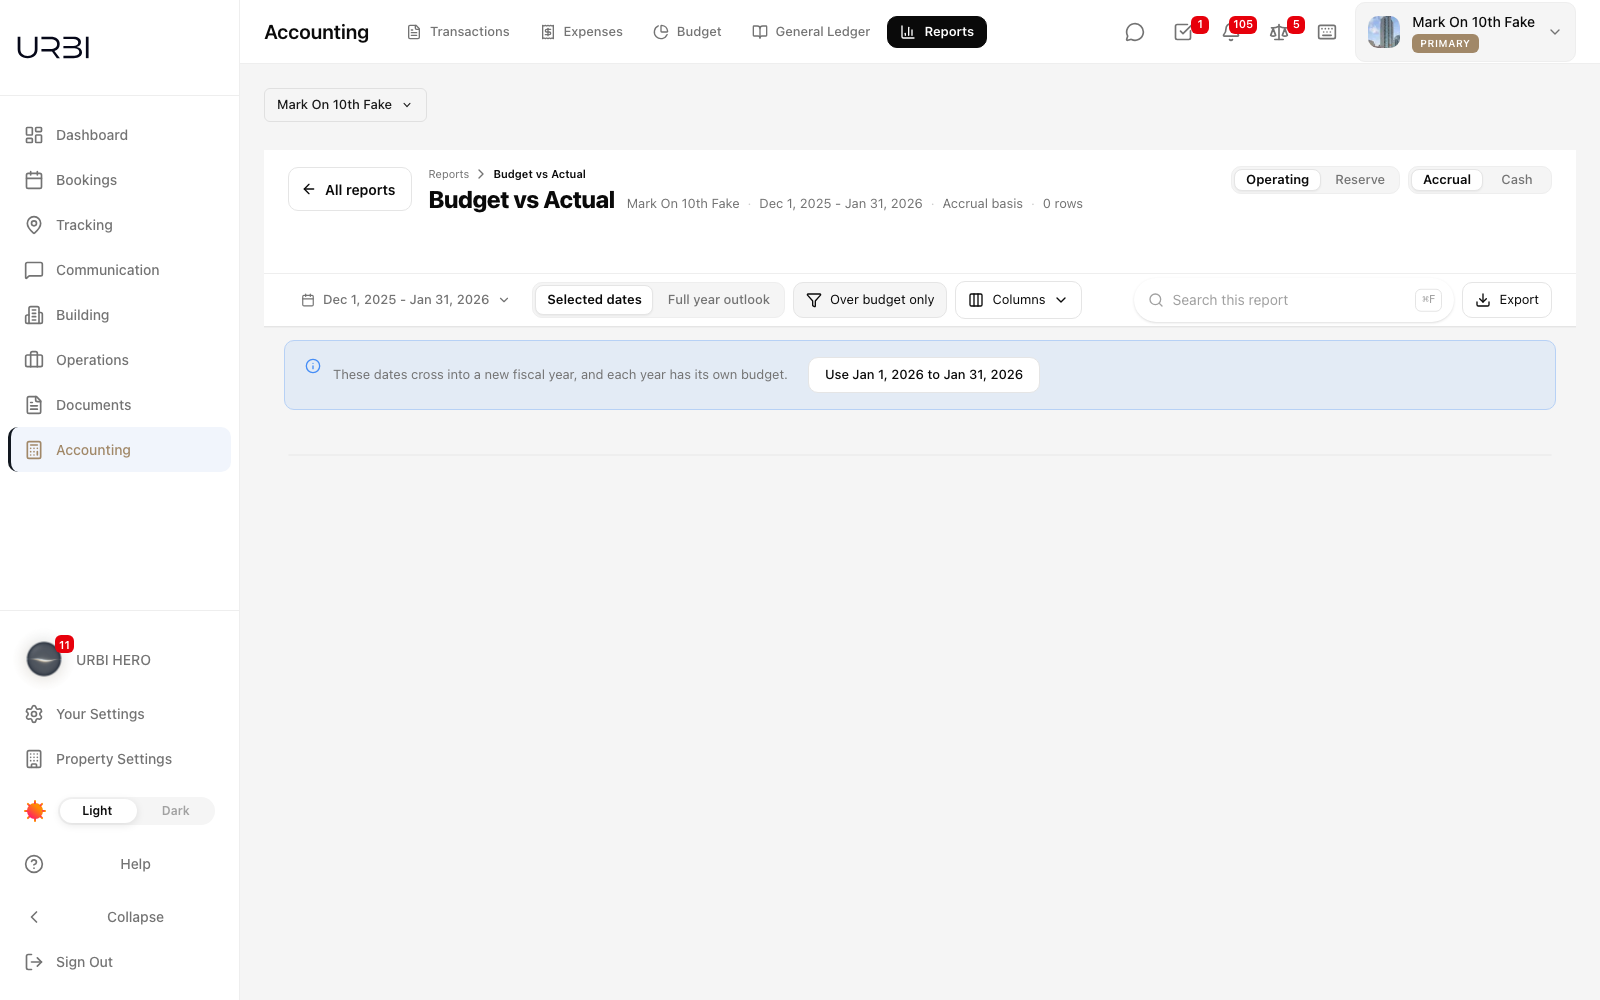
One fiscal year at a time. Each fiscal year has its own budget, so a range that crosses into a new fiscal year is not calculated. A note reads These dates cross into a new fiscal year, and each year has its own budget. and a button that offers the part of your dates that sits in a single fiscal year, for example Use Jan 1, 2026 to Jan 31, 2026. Select it to keep working with that part, or choose new dates.
The variance colour and sign were corrected. Overspending now reads as a negative figure in red. Underspending now reads as a positive figure with a plus sign, in green. That sign had been reversed: on live data, a property that had overspent by $74,983.76 saw that figure rendered as a positive number, in the colour normally used for good news.
One property's overspending, before and after
| Version | Variance shown |
| Old report | +$74,983.76, read as good news |
| Corrected report | -$74,983.76, read as overspending |
This account now matches the same account's variance on the Income Statement and on Expense by Account.
This report now agrees with the Income Statement and with Expense by Account on every account's variance. Before this fix, the same account could read differently depending on which of the three you opened.
Exports match the screen. The PDF and Excel file say what the screen says.
- Budget used in Full year. In Full year outlook, Budget used is what has been spent so far, to the date of the report, against the whole year's budget. The PDF, the Excel file, the Spent so far tile and the AI summary all use that figure, so a month early in the year no longer reads as nearly spent in the file while the screen says 0%.
- The Full year tile sentence. The PDF tile reads "(amount) year-end net result, against a budget of (amount)." Selected dates PDFs keep their own wording.
- Over budget only. The screen, the PDF and the Excel file list the same accounts and groups, and the "N of M" count is the same in all three. An overspent group whose budget sits in other months is no longer left out. In the Excel By month sheet, a group with a budget of zero in every month is not listed.
- The year strip. The strip in the PDF counts the months you selected and is dated by the report's end date, as it is on the screen.
- Zero amounts. A summary tile with nothing in it shows a dash, on Budget vs Actual and on Vendor Spend, Work Order Cost and Expense by Account.
- AI summary on the PDF. The Budget vs Actual PDF includes the AI summary. Export from Reserve and the summary is about Reserve, not Operating.
- No activity in your dates. When the dates you picked have no spending or revenue, the insights strip does not write a summary. It reads: No spending or revenue in the selected dates. Pick a wider range to see insights.
- Reallocations. The Full year footnote reads "including 1 reallocation" for one, and the plural for none or several.
A group with accounts in both funds. When a budget is set on a group that holds accounts in both the Operating and the Reserve fund, the group's budget is carried once, in Operating. The group's Reserve accounts still appear in the Reserve view, with their actuals, as accounts without a budget.
PDF export: Exports as a landscape PDF so the full set of columns fits on the page. Each page repeats column headers and the property letterhead.
Reserve Fund Report
Who sees it: Residential condo and HOA properties only.
The Reserve Fund Report shows the opening and closing balances of the property's reserve fund for the selected period, along with contributions received, interest earned, and withdrawals made. It is designed to support the annual reserve fund disclosure requirements common in condo/HOA governance.
Key fields:
- Opening balance: reserve fund balance at the start of the period.
- Contributions: amounts transferred into the reserve during the period.
- Withdrawals: amounts drawn from the reserve for approved capital projects.
- Closing balance: net ending position.
This report card does not appear on commercial or mixed-use properties because those property types do not carry a reserve fund in URBI.
PDF export: Portrait layout. Designed to be attached to board meeting packages or owner disclosure packages.
Cash Flow Statement
Who sees it: All property segments.
The Cash Flow Statement shows the money that moved in and out of the property's bank accounts. A summary at the top gives the Net change in cash for the period, with the cash received, the cash paid, and the cash on hand at the end of the period. Below it, the activity is grouped into sections:
- Operating activities: day-to-day receipts and payments. Cash received is broken out by category (rent, fees, and other income collected). Cash paid lists operating payments (maintenance costs, management fees). Refunds and reversals appear on their own line, so they are never netted into other income. Payments on bills show under Accounts Payable; open that line to see each bill's expense account.
- Reserve fund activities: cash moved in or out of the reserve fund.
- Trust activities: cash moved through trust accounts. This section appears only when trust cash moved in the period.
- Financing activities: loan proceeds and repayments.
Below the sections, the report shows the Net change in cash, then Cash at beginning of period and Cash at end of period. A note under the table confirms that the ending cash ties to the Balance Sheet, with a link to open it. If the two do not agree, the report says so and shows the difference.
Use the comparison menu to set the period next to a prior period. The report then shows This period, Prior period and Change columns.
For a period with no cash activity, the report still shows the cash summary: opening cash equals closing cash and net change is 0.00. An empty activity list does not mean the cash position is missing.
Basis: This report is always prepared on the cash basis regardless of the accounting basis selected elsewhere. There is no basis toggle on this report.
PDF export: Portrait layout.
Cash Flow Forecast
Who sees it: All property segments, where the plan includes it.
The Cash Flow Forecast projects the property's future cash position based on scheduled receivables (upcoming charge cycles, lease renewals) and known or estimated outflows (recurring vendor contracts, budgeted capital expenditures).
How to read it:
- The forecast horizon is configurable (30, 60, or 90 days).
- Each row shows a projected inflow or outflow line item with the expected date and confidence level.
- The running balance column shows the projected bank balance after each item.
- Items derived from actual scheduled data (charge schedules, lease terms) carry a higher confidence than items estimated from historical run rates.
This report card only appears on properties whose plan includes cash flow forecasting. Where it is not included, the card is hidden.
PDF export: Portrait layout.
Service Ticket Summary
Who sees it: All property segments.
The Service Ticket Summary is a governance and operations view that aggregates service tickets for the selected period. It is designed for governance reporting and management review, not for day-to-day ticket handling.
What it shows:
- Total ticket count, broken down by status (open, in progress, closed).
- Average time to resolution for the period.
- Ticket counts by category (e.g., plumbing, electrical, common area, amenity).
- Associated costs where expenses have been linked to tickets.
Common use: Attach to monthly governance packages to show the volume and cost of maintenance activity, or use during annual budget planning to estimate maintenance spend.
PDF export: Portrait layout.